Toolkit Overview : Define : Plan : Gather : Preserve : METADATA : Storytelling : Share : Recommendations
El Grito de Sunset Park Use Case
METADATA INTRODUCTION
WHAT IS THIS?
Metadata is essential because it makes it possible to identify, find, understand and analyze video. For example, knowing where a video was shot, when, and by whom, is extremely important for understanding the video content. Without metadata, you might not be able to authenticate a video, or to recognize the importance of a piece of footage (and without technical metadata, your video player won’t even know how to play the video!)
This page outlines the steps we took to collect and create metadata for the El Grito project. The following pages outline the steps we then took to turn the information structure that emerged from our work into a reusable data model.
WHY DO THIS?
Metadata is key to any curation or archiving project.
Metadata literally means “data about data.” In this case, our “data” is video, so metadata is any information that describes the video. Metadata can include descriptive, technical, structural, and administrative types of information.
GETTING STARTED: TWO APPROACHES
How to get started with describing your videos? Two ways are outlined here:
Approach #1 starts from the content or data, such as video, in your collection. This is a useful approach when you don’t know exactly what content or data you have, or what you might want to do with the information. This is a “starting from scratch” approach that will help you get a better grasp of your collection.
Approach #2 starts from the questions that you want your content or data to answer. This is a useful approach when you already have a basic idea of what content or data you have, and a sense of what information you want to get out of that content or data.
Before you start reviewing the contents of your collection, you will need to set up a place to record and store the metadata you will collect.
There are a lot of options, from basic to complex, but the main requirement is that the software or platform enables you to structure your metadata. Structured metadata is data that is organized, like a form, with labels that name or classify the data. For the purposes of getting started, a spreadsheet with labeled columns is probably the easiest way to create or collect structured metadata.
As you refine your structure and clean-up your data, you may eventually decide to migrate your metadata to a different platform. The great thing with creating a spreadsheet in a format like Google Sheets, Calc, or Excel is that you can export your metadata as a CSV (comma-separated values) document, which is a widely used data exchange format.
El Grito Example
For the El Grito project, we used a Google Sheet to record metadata, with additional scripts to add functionality. Google Sheets was a good choice for this project because multiple people needed to access and work on the document, and because the videos were stored on a Google Drive.
We used a Google app script to initially populate the spreadsheet with a list of all the videos files on the Google Drive that we would be creating and collecting metadata about.
2
Follow a schema or make your own
Before you can start adding metadata, you need to create columns with labels in your spreadsheet, and possibly value lists, or drop-down lists, for permissible entries.
Depending on your project, you may have a pre-existing metadata scheme you want to follow or adapt (e.g. based on a community standard, or from a like-minded organization). If you don’t, and are starting from a blank slate, the best places to begin identifying what metadata to collect are: the people who created the content, the content itself, and the envisioned users of the content. These steps are outlined below.
This approach to developing an information structure from scratch will be iterative and require several revisions and clean-up. What you end up with will likely be different from what you started with!
You can eventually conceptualize and represent the information structure that emerges in a clearly defined data model and metadata schema, that you can use, document, and share with others. This process is discussed in the following sections.
3
Create your scheme: Help from content creators
Before reviewing the videos to understand and describe what you have, it is helpful to talk to the people who filmed them.
The person who filmed a video is a primary source of information about where and when a video was shot, what events it depicts, and why the event may be important. It is therefore extremely valuable to glean this information from content creators, and to try to organize it coherently on your spreadsheet.
As in El Grito, content creators are often the people who are most familiar with the issues and have experience using the content in their advocacy work. They can provide valuable insight about what pieces of information are important to record in your spreadsheet, and what kinds of terminology to use.
El Grito Example
Prior to viewing the videos gathered for the El Grito project, we talked with El Grito about the project, what they knew about the videos, and what information about the videos they thought was most important to track. From this, we created a few basic columns in the spreadsheet together. These preliminary columns included:
- Whether the video was filmed in Sunset Park
- Whether the video was filmed during the Puerto Rican Parade
- Any alleged abuses by police recorded on the video
- Incident location
- Incident date
- Police car plate number
- Officer description
- Officer name
- Officer badge number
- Allegations / misconduct tags (using terms borrowed from the Berkeley Copwatch Incident Report Template)
This gave us a good-enough starting point for populating the spreadsheet once we starting reviewing the videos.
Berkeley Copwatch Example
Our collaboration with Berkeley Copwatch built on the work with El Grito and enabled us to build a more robust database model in File Maker Pro. Read more about the work and download our resources and templates here.
4
Create your scheme: What will users want?
While you might not know exactly what data you have yet, and how it might be useful, it is a good time to start envisioning who the potential users of your data might be, what kinds of information they are interested in finding, and how they want to be able to search for content.
Seek out guidance from stakeholders such as advocates who work on similar issues, others groups that have done similar data projects, or community members who support your work.
With some understanding of what future users will be looking for, you can watch the videos with an eye to this information, and create columns and value lists (e.g. controlled vocabularies) in your spreadsheet to best capture it.
5
Populate the sheet: Check file metadata
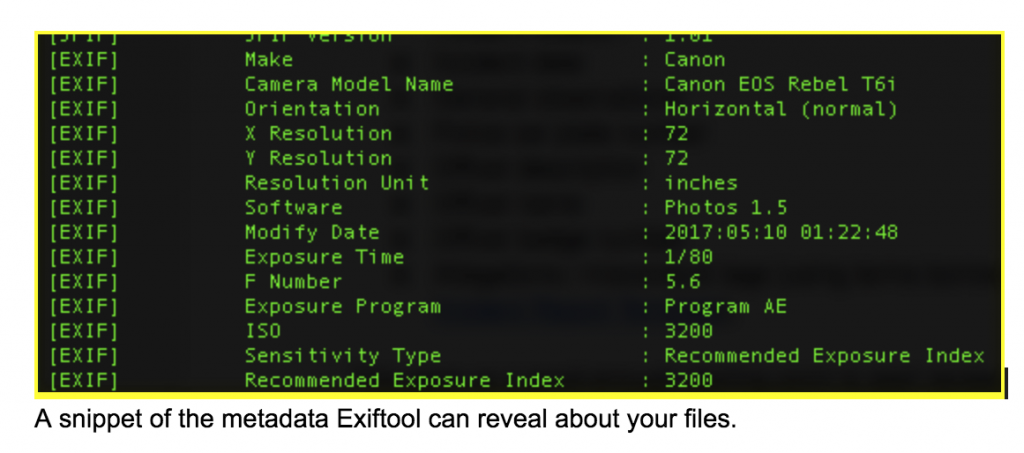
Video files can give you some information about themselves without you needing to watch them. While you should not expect the file metadata to contain all the information you are seeking, certain metadata can be useful for:
- Identifying where a video came from (e.g. creation date, GPS location, camera model, photographer name if photographer added it in their camera settings).
- Authenticating a video (e.g. you can usually tell if a video came straight from a camera or was exported from video editing software, and when it was last modified).
- Assessing video quality (e.g. you can see the video format, framesize, bitrate, filesize, and other information that is indicative of its audiovisual quality).
You can decide what is useful, and populate columns in your spreadsheet with this extracted metadata. Be aware, however, that embedded metadata may not be always accurate; for example, if the date and time was not set correctly on the camera.
How Do You Access File Metadata?
If you’ve ever pressed Command (or Ctrl)-I in a video player, you’ve seen some of the technical metadata in a video file. Here are other tools that can enable you to view even more metadata in your video files:
- MediaInfo is a free and open source tool that displays the metadata in your video files. It comes in a GUI (i.e like an app) version and a CLI (i.e. command line or Terminal) version. It is good for all kinds of video.
- Exif Tool is a free and open source tool primarily for displaying (and editing) metadata in digital photos, but can also be used on video files. It works best on videos that are shot on still photo cameras, like DSLRs. It is command-line only.
6
Populate the sheet: Watch the videos
Watching the videos is of course a key way to glean information to populate your spreadsheet! It can also help you identify additional pieces of metadata that you need to collect (i.e. new columns or values to add to your spreadsheet). For example, after watching several videos, you may start noticing certain themes in the footage that would be worthwhile to track. Or you might see useful types of details in the footage that would help identify certain people, places, or events.
Remember that if you are building your metadata up organically and adding new columns and value lists to your spreadsheet as you go along, you may need to go back and update the records that were previously created.
El Grito Example
Following an initial ‘testing day’, one WITNESS staff member and one El Grito volunteer worked together to watch the videos and add metadata to the spreadsheet, each taking on different sections of the spreadsheet. Overall, 1708 video files were viewed, and 213 were found to pertain to Puerto Rican Day Parade.
An El Grito volunteer and three project staff then spent a day watching footage and testing out the spreadsheet again to see what information we were noticing that wasn’t already included in the current spreadsheet. From this, we added the following columns to the spreadsheet:
- General observations about video: A column for more long form/free flow description.
- Incident Date: We added a controlled list of the dates of each year’s Puerto Rican Day parade dating back to first video file date; non-PR parade dates could be entered manually.
- Additional links: A column for links to contextual information we found about an incident such as newspaper articles and social media posts.
- Officer misstated the law/right to record? Unaware of the law?: We noticed that this happened frequently, and added a column to track occurrences.
- Was the incident formally reported or complaint filed to NYPD, Internal Affairs, CCRB, legal services (Legal Aid) others?
- Original file?: As went through more files we noticed some were derivatives of an source file, and wanted to flag these relationships.
- Logger: For the initials of the person creating the metadata.
- Related videos in collection:To list relevant identifiers for related videos.
- Creator:The names of the individual who filmed a particular video when appropriate to do so – generally this column was left blank.
- Bag ID: where we recorded the ID number generated via the “Preserve” workflow.
Tips and observations from the El Grito project on factors that affected what metadata could be collected:
- In general, it was difficult to track badge numbers (located on shirt-fronts) and precinct numbers (located on shirt collars) as the copwatcher is typically moving rapidly to film an incident and doesn’t have time to focus. One must scroll slowly through video and freeze the frame when the focus is clear. It’s best to use a video players with scrubbing/scrolling functions.
- Sometimes a copwatcher would say badge number or cop’s name out loud – while this is useful for description, copwatchers should not in any way verbally editorialize while shooting video.
- It was often difficult to describe officers when they are in uniform, especially with hats on, as they generally look the same. It is easier to describe and identify plainclothes officers.
- Police car registration number plates are typically legible.
- As copwatchers typically record in a team, we generally saw one incident unfold through three different camera lenses and three different angles – this 3D-like effect enabled us to create rich descriptions of incidents. If one copwatcher didn’t focus on a badge or had fuzzy footage, this footage was supplemented by a copwatcher who captured very clear footage but shot from a different angle.
- Work with a buddy! Having two sets of eyes was critical when it came to visually verifying details like hard-to-decipher officer badge numbers and plate numbers.
- In order to determine location of incidents, we looked for street signs (generally legible) or looked up store/restaurant names on Google.
7
Refine metadata rules and definitions
As you consult with creators and stakeholders, and populate your spreadsheet, you will gradually determine what types of metadata you want to collect, define what terms mean and how they should be used, and set out syntax rules for how information is entered. Keep track of these definitions and rules as you go along.
Clearly documenting these definitions and rules is especially important if you are working in a team. For example, if your spreadsheet has a column for “Alleged Misconduct,” it is important that everyone understands what constitutes misconduct like, say, “excessive force” or “nonverbal harassment,” so that the footage is tagged consistently and accurately. Failure to do so may make your data unreliable and therefore unusable.
Besides ensuring accuracy, data entry rules also makes sorting and finding information easier. For example, if everyone enters dates in yyyy-mm-dd format, days and months will not get confused, and rows can be sorted by ascending or descending date.
To make it easier for people to comply with metadata rules, you can use built-in tools in your spreadsheet software like auto-formatting or drop-down lists.
Check out how we approached this challenge by developing a Data Dictionary and Controlled Vocabulary in collaboration with Berkeley Copwatch.
8
From rough metadata to data model
Building your metadata structure from scratch is an iterative and organic process. After consulting with stakeholders (e.g. creators and users) to understand their metadata needs, and working directly with the materials and content to populate and revise your spreadsheet, a structure will start to emerge.
Sometimes the structure will not be immediately obvious. When building from scratch, it’s not uncommon to end up with dozens of columns that are difficult to scroll through, multiple spreadsheets all over the place, and messy data. At this point, it is useful to step back and look at what information has been gathered, what the information describes, and how different bits of information relate to each other.
The following sections in this toolkit describes the process of building a data model, which is an abstract representation of an information structure. A data model is the foundation for building a structured database. By getting started through this organic process, you ensure that your eventual metadata structure reflects content you are working with, and anticipates potential uses down the line.
The steps below provide guidance on the first steps for creating a scheme to describe your videos based on the information you want to glean from them, and for identifying any additional information you want to collect to supplement your video documentation.
This works best if you already have a basic idea of what videos you have, and a purpose in mind for the metadata you are collecting.
1
Define the overall objective for the project
The makeup and design of your metadata will depend a lot on your overall objectives. What do you want to use your data or metadata for?
For example, consider the varied objectives of the following online police accountability databases, and the kind of data they subsequently collect:
| Project | Stated objective | Types of data collected |
| Citizens Police Data Project, Invisible Institute | To provide “a portrait of impunity backed by the police department’s own data. We built CPDP so that data about police activity can be useful to the public.” | Data on police officers, unit history, salaries, awards, and complaints. |
| Open Oversight, Lucy Parsons Labs | “To improve police accountability using public and crowdsourced data. We maintain databases of police officers in several cities, providing digital galleries that make identifying police officers easier for the public, including for the purpose of complaints.” | Data about officers’ identities, assignments, and photographs. |
| Who Was In Command, Security Force Monitor | “To help human rights researchers, investigative journalists and anyone who wants security forces to be more accountable.” | Data about official state or state-sanctioned organizations; persons affiliated with organizations; publicly-documented allegations of human rights violations committed by security forces. |
Try using the El Grito Workbook to think through your goals for your project. From there, identify the types of data, from your videos and otherwise, that you will want to gather to serve those goals.
2
Make a list of questions
Databases provide responses to user queries. So when designing a metadata scheme, it makes sense to think about the questions that you, or another future user, might want to ask of the metadata.
Consider the goal or objective of your data project, and brainstorm a list of the questions you want to “ask” your data that will serve your goal.
Berkeley Copwatch Example
Berkeley Copwatch has been gathering data on policing incidents for many years. We worked with them to refine a data model so they could make better use of their data.
We brainstormed questions that they would like to be able to answer using their data. Here are just a few:
- Which videos show which incidents involving which officers?
- Which officers most often use force?
- What kind of force are officers using?
- What are the histories of incidents for each officer?
- Who else was present at an incident? What did they do?
- Are officers deliberately interfering with the right to watch? Which officers?
3
Refine your questions
After an initial brainstorm, you can start to prioritize and refine your list of questions. Consider:
- Is it a question your data can answer? For example, you may not have the data to answer “Are officers passing abusive techniques to other officers?”, but you may be able to answer other questions, like “Which officers have committed documented abuses?”, “What units, agencies, and departments are those officers part of?”, “Who else in those units, agencies, or departments have also committed abuses?”
- Do you have the necessary data, or will you realistically be able to obtain the necessary data, to answer the question?
- More questions may mean a more complex metadata structure. If it turns out you can’t address all of your questions in this project, which ones are the priorities?
Databases can typically fetch, match, filter, sort, count and perform other calculations on data. Try to construct your questions in ways that can be translated into database queries. Some tips:
- Clearly identify the types of persons, organizations, objects, or events (i.e. the “what”) you are asking about. E.g. police officers, police departments, photographs, human rights violations, etc.
- Be specific about what you are interrogating. Use “question” words like “when,” “how many,” “how frequent,” “where,” “who,” “what type,” etc.
- If your question asks about persons, organizations, objects, or events in relation to other persons, organizations, objects, or events, state the relationship that you are interested in between the two entities. E.g. “Which videos document which incidents?”
4
Start creating data model based on questions
Once you have your set of questions, you can use them to start identifying entities, attributes, and relationships in a data model! This process is outlined in detail in next section, and in the slide deck to the right.
TRAINING SLIDES

This Data Models and Databases 101 slidedeck was used for a training with Berkeley Copwatch in April 2018.
This work is licensed under a Creative Commons Attribution-NonCommercial-ShareAlike 2.0 Generic License 